

I Reverse-Engineered John Paulson’s Event-Driven Strategy. Here is the Code That Screens 5,000 Equities Every Morning.
Automating merger arbitrage, spinoffs, and corporate catalysts with the 'Paulson' engine. (Codebase included for paid subscribers).

While most investors argue about whether the macro regime is inflationary or deflationary, the real edge lies in something largely uncorrelated: corporate catalysts.
I realized this after watching traders try to play biotech PDUFA dates or merger arbitrage manually. Holding a basket of stocks into earnings isn’t an edge. Without a hard catalyst, you are entirely at the mercy of the broader market moving up or down. You aren’t investing in the company’s fundamentals; you are just renting exposure to the S&P 500.
So I built a system to fix it.
Before / After: The Hidden Catalyst Problem
Before
– 10 browser tabs checking ClinicalTrials.gov, SEC EDGAR, and earnings calendars
– Manual probability math refreshed once a quarter in Excel
– Missing a hidden spinoff because it was buried on page 84 of a 10-Q
– Portfolios blow up during macro shocks because the positions lacked hard, idiosyncratic catalysts
After
– A live event-driven dashboard that tracks corporate timelines daily
– True independent bets: quantified spreads on merger arbitrage, stubs, and bankruptcies
– Live probabilities for each event outcome (Close, Delay, Break)
– Algorithmic “Confidence Scoring” automatically updating as filings drop
– Explicit sum-of-the-parts math instead of hand-wavy “undervalued” marketing
This week, I deployed a John Paulson-inspired event-driven engine. It monitors corporate actions in real time, executes passive spread calculations, and tracks exactly how much true idiosyncratic edge exists in the book.
Here is the exact architecture I built, and how you can run it.
The Paulson Edge
In 2013, John Paulson’s team identified a structural inefficiency in the telecom market. SoftBank had bid $5.75 per share to acquire 70% of Sprint.
While the rest of the market traded the standard merger spread, Paulson’s team crunched the historical acquisition multiples and realized the bid was too cheap. They calculated a high probability that a competing bidder would emerge.
So they bought 220 million shares of Sprint.
Shortly after, Dish Network entered a competing bid, forcing SoftBank to raise its offer to $7.75. Paulson made $2 per share, locking in a $440 million profit on a single corporate event.
That is the essence of Paulson’s event-driven philosophy: when you find an asymmetric, mispriced corporate event, you “go for the jugular” as Soros would say.
The issue? Doing that level of due diligence, comparing historic M&A multiples, analyzing target lock-up agreements, and tracking insider accumulation across thousands of equities, takes a team of elite analysts days.
This system does it in 45 seconds.
The Architecture of Special Situations
Event-driven investing is simple to state and hard to implement. You need to find situations where a specific corporate event, not general market direction, drives the stock. Spinoffs, clinical trial results, mergers, bankruptcies.
The problem? The data is scattered. SEC EDGAR is a mess of text. ClinicalTrials.gov is archaic. Delaware Chancery Court dockets shift constantly. To actually calculate a merger spread, map it to regulatory pushback, and adjust probabilities without forward-looking bias takes days in Excel. By the time you finish, the spread has already closed.
This system automates the entire workflow in four phases.
Phase 1: Live Regulatory Data Ingestion
Official SEC EDGAR alerts have a lag, and financial news aggregators are a good way to always be late.
To bypass the lag, the engine builds a tiered ingestion pipeline.
It hits high-frequency data feeds for Schedule 13D (activist filings) and Form 4s (insider trading), routing them into a hot cache (.tmp/event_cache/hot/regulatory). It also scrapes Delaware Chancery court dockets (delaware_chancery.py) for live updates on contested mergers.
For slower-moving structural data, it pulls full 10-K/10-Q dumps (edgar.py), FDA phase readouts, and upcoming earnings calendars. It converts this raw text into structured JSON, so you have a live view of corporate actions instead of reading through 200-page PDFs.
Phase 2: The Deal Confidence Scorer
Most retail traders just have a list of dates. “Earnings on Thursday.”
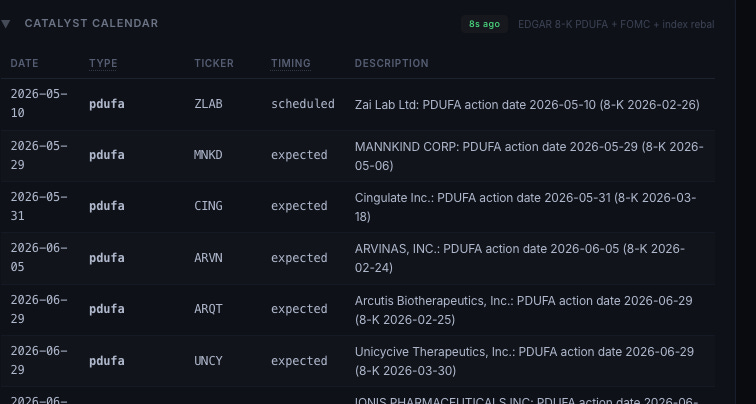
This system pushes every event through a probability matrix (catalyst_calendar.py). Instead of forcing a binary “will happen / won’t happen” label, it calculates a realistic probability for the event timeline:
“This merger has an 82.4% probability of closing on schedule, 12.1% probability of DOJ antitrust delay, 5.5% probability of a break fee.”
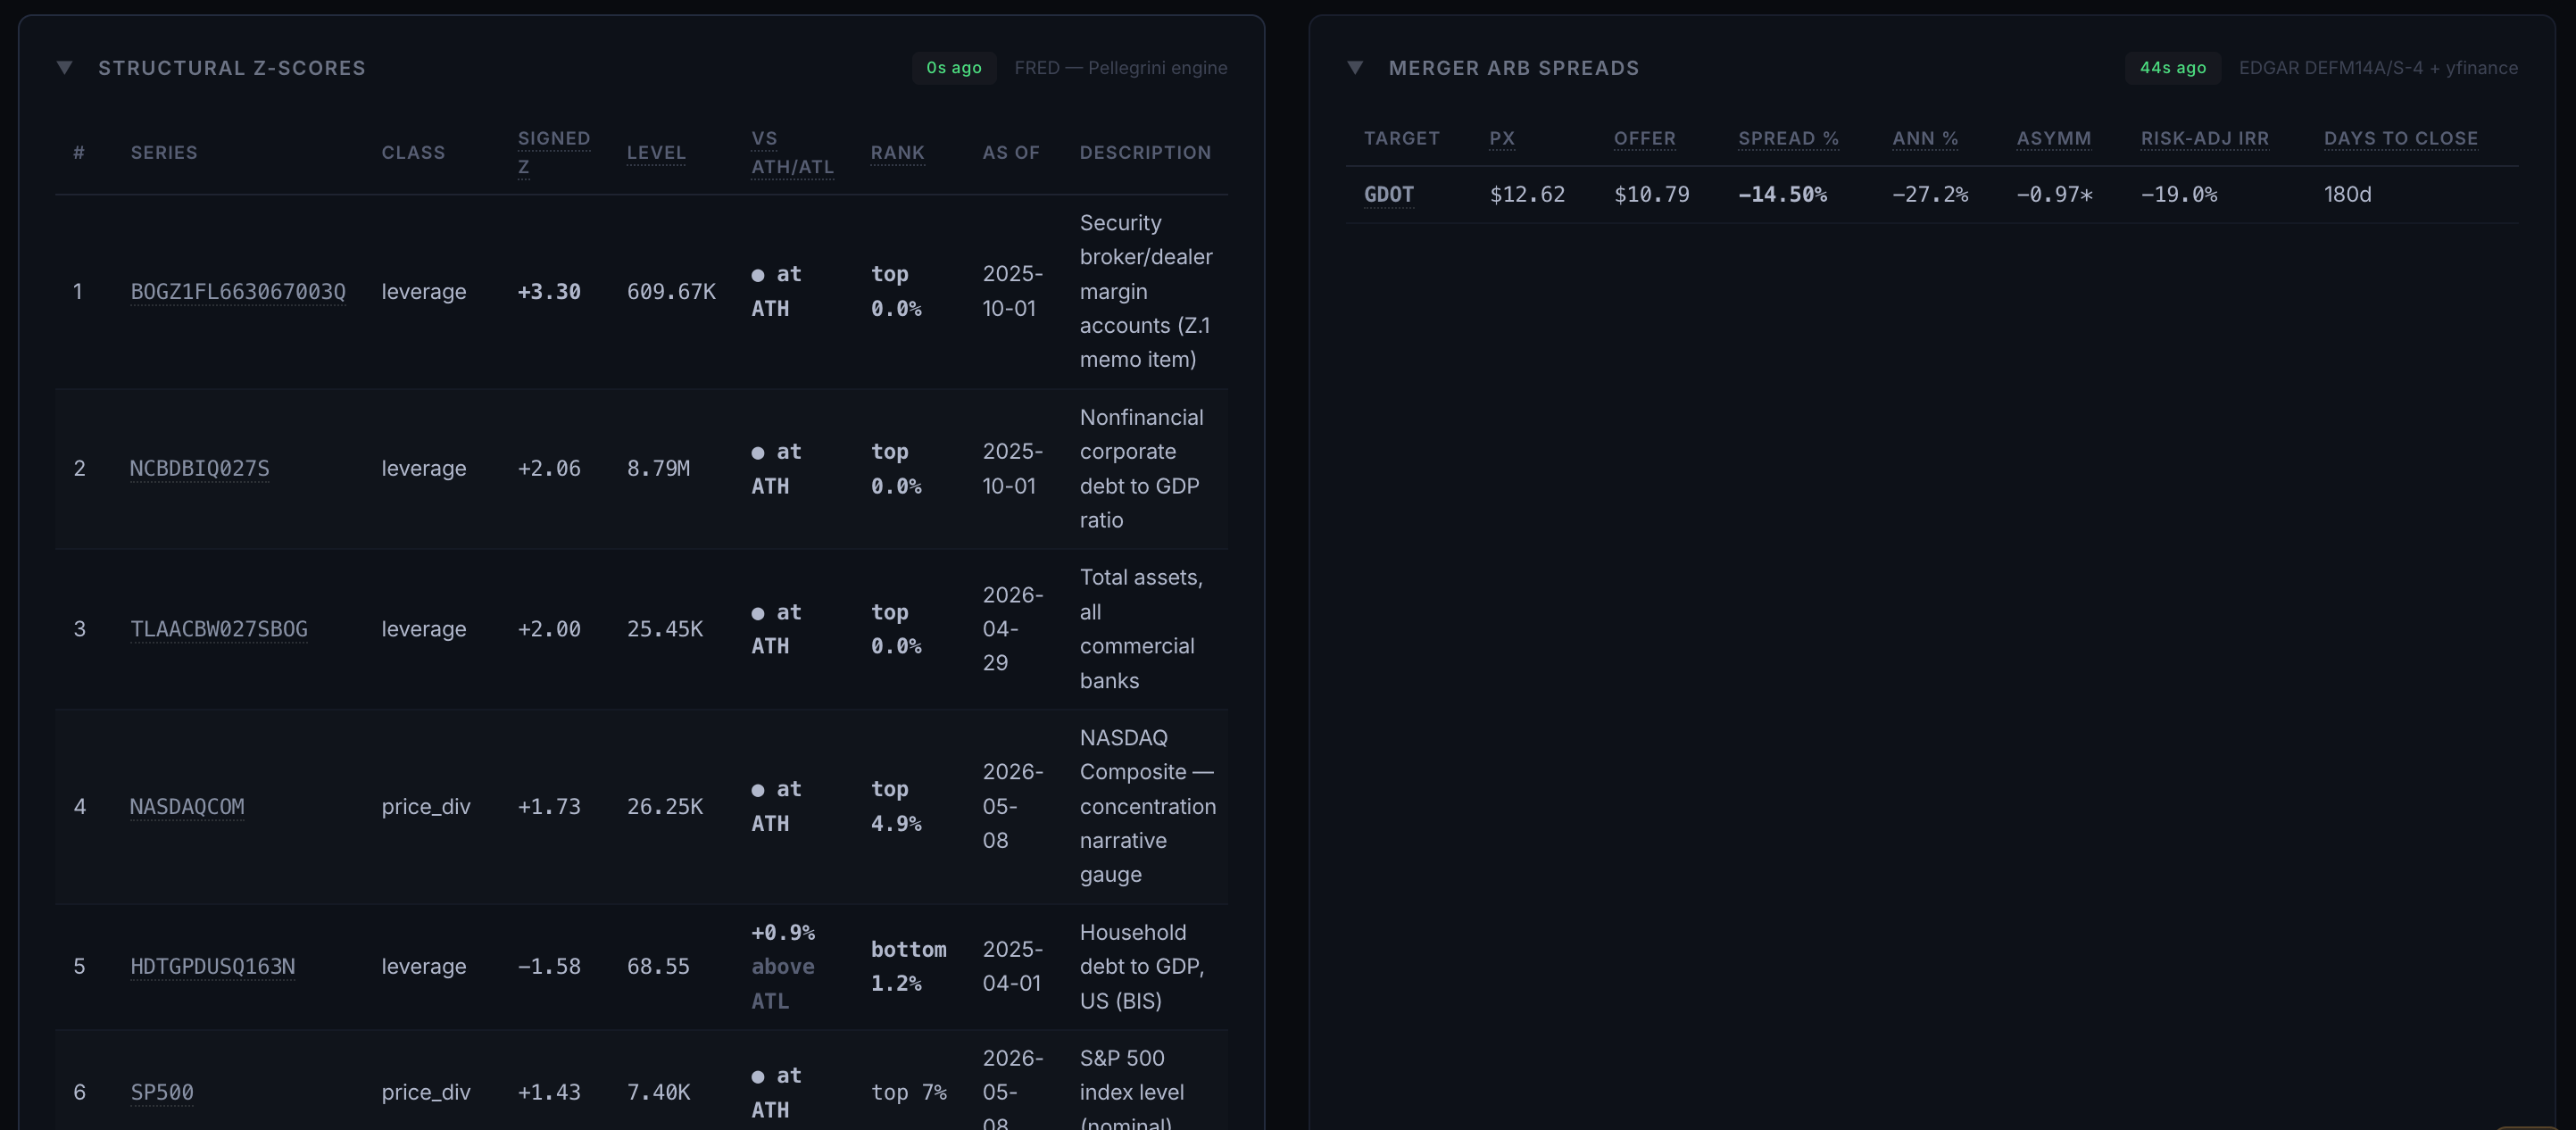
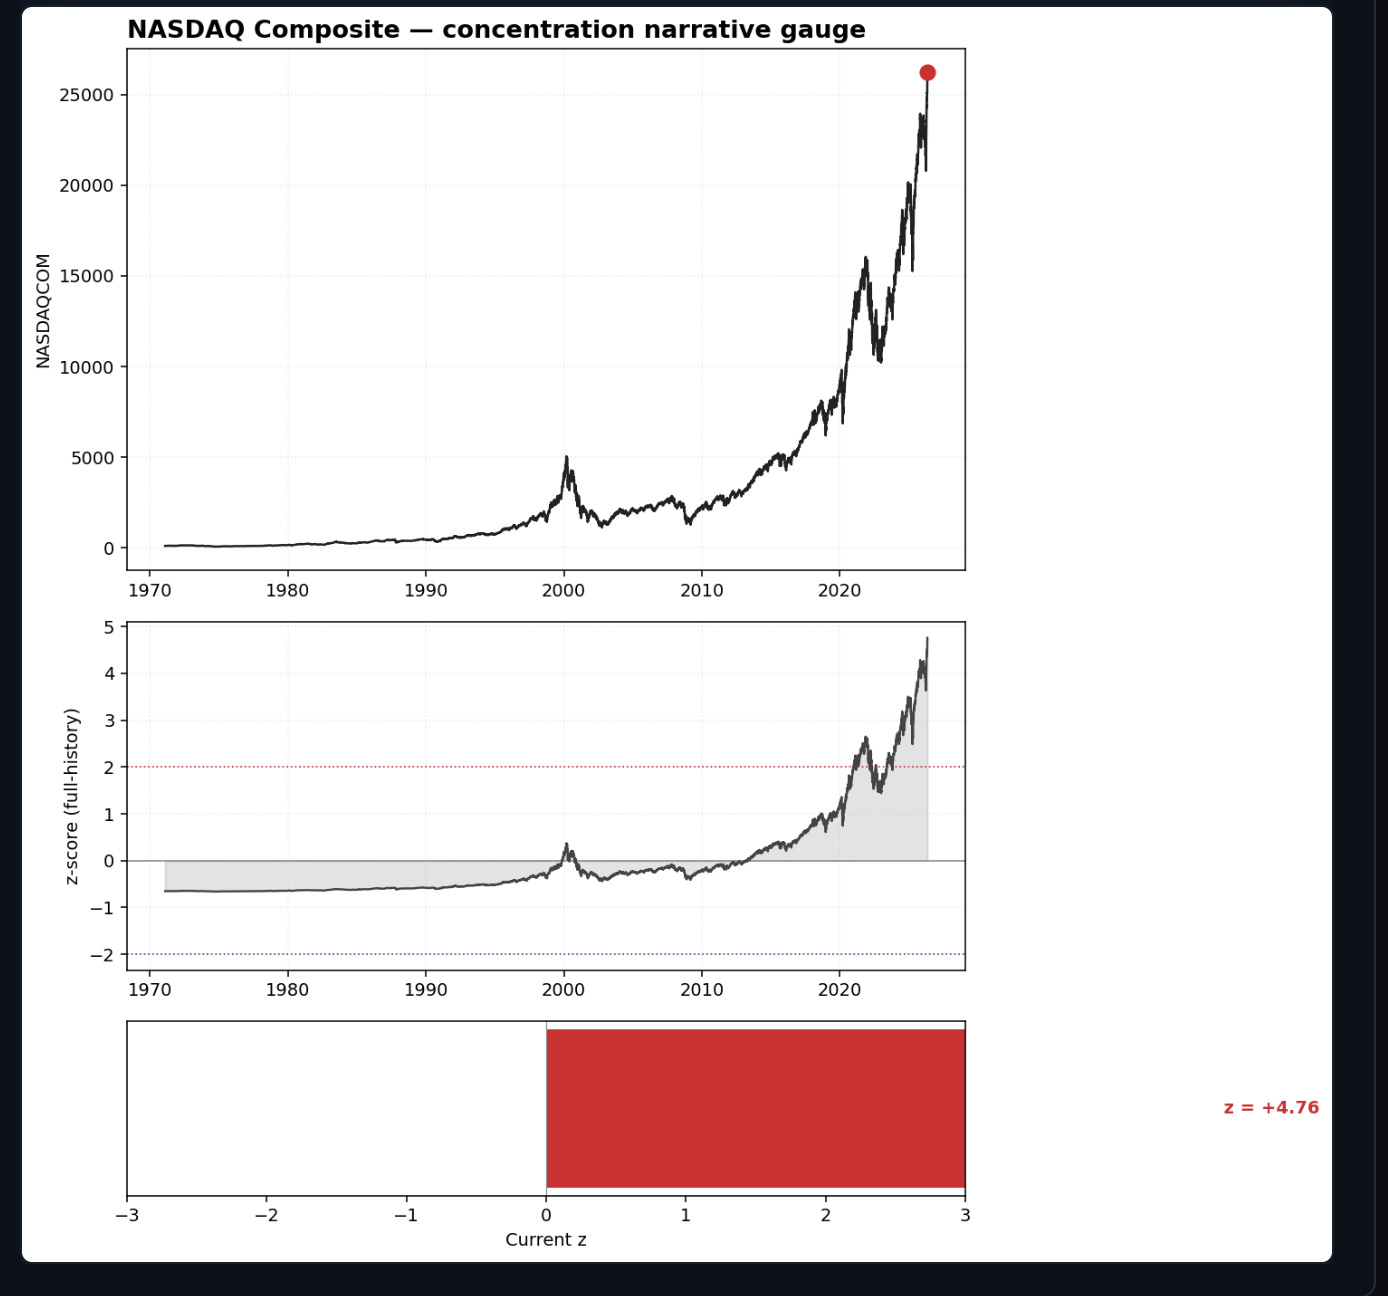
The orchestrator looks 90 days out and assigns a confidence score to every event. The confidence score is tied directly to these probabilities. It cross-references the event date against historical management reliability, recent insider accumulation, and sector-wide regulatory hostility, so risk shifts with the facts, not with your mood.
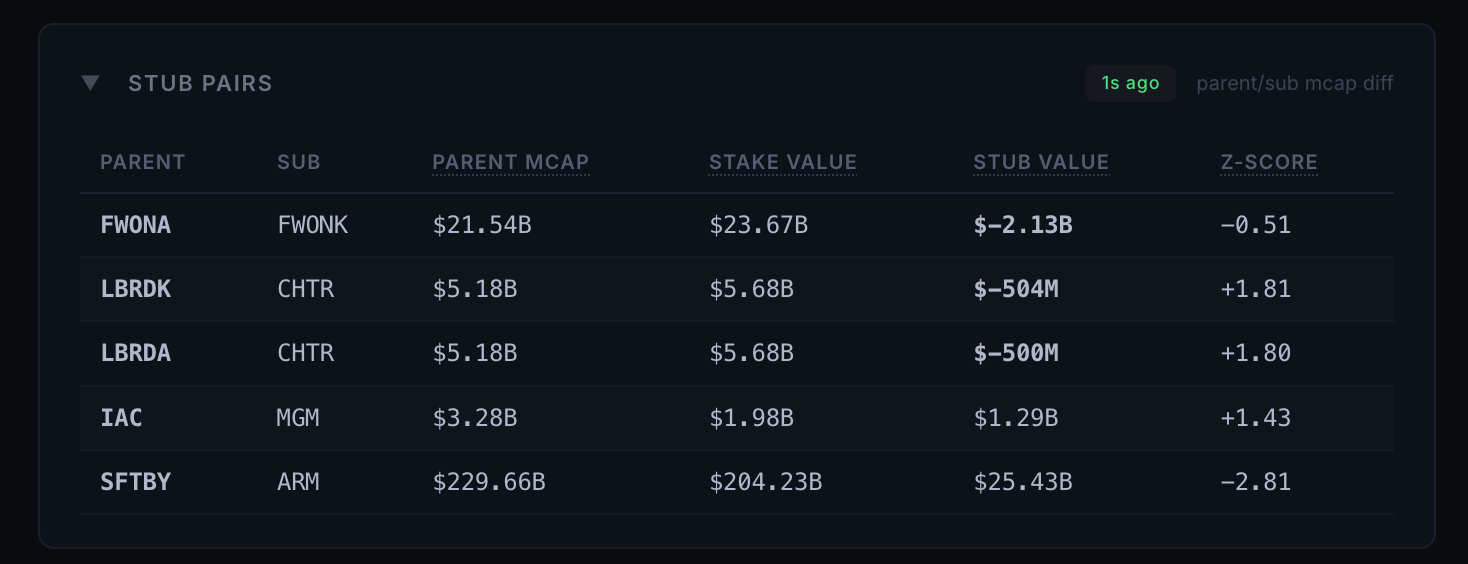
Phase 3: The Stub & Spinoff Gate
This is where the math gets structurally complex.
“Stub equity” refers to the remaining equity of a company after it spins off a highly valued subsidiary. Often, the market misprices the stub because the financials look temporarily messy post-spin.
The engine forces every spinoff through a rigorous sum-of-the-parts gate (stub_scanner.py and spinoff.py):
By stripping out the market cap of the spun-off entity and isolating the parent company’s core debt and operating cash flows, it manufactures an objective valuation.
It mixes these valuations with 13F institutional ownership data (thirteen_f.py) to calculate the true implied Enterprise Value of the stub. Right now, the scanner is tracking several stubs trading at a negative implied enterprise value, meaning the market is paying you to own the core business.
Phase 4: Why This Engine Stays Spread-Only
When you finally map out all upcoming catalysts, the amateur move is to blindly buy out-of-the-money calls hoping for a jackpot.
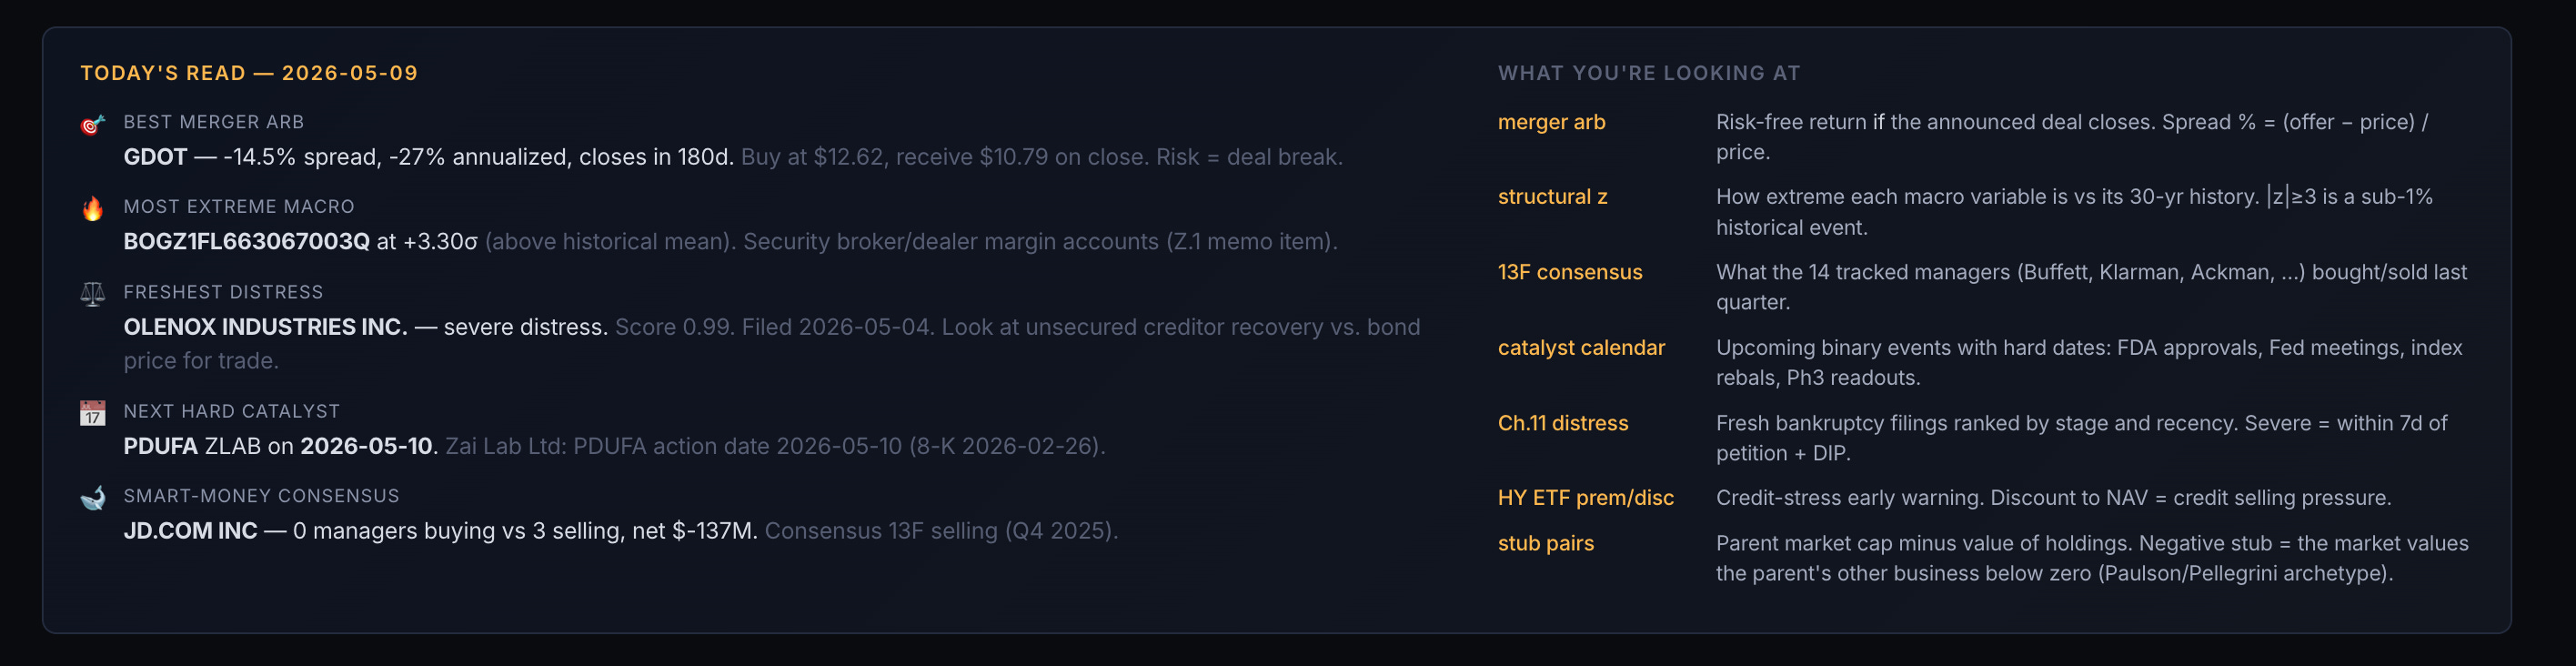
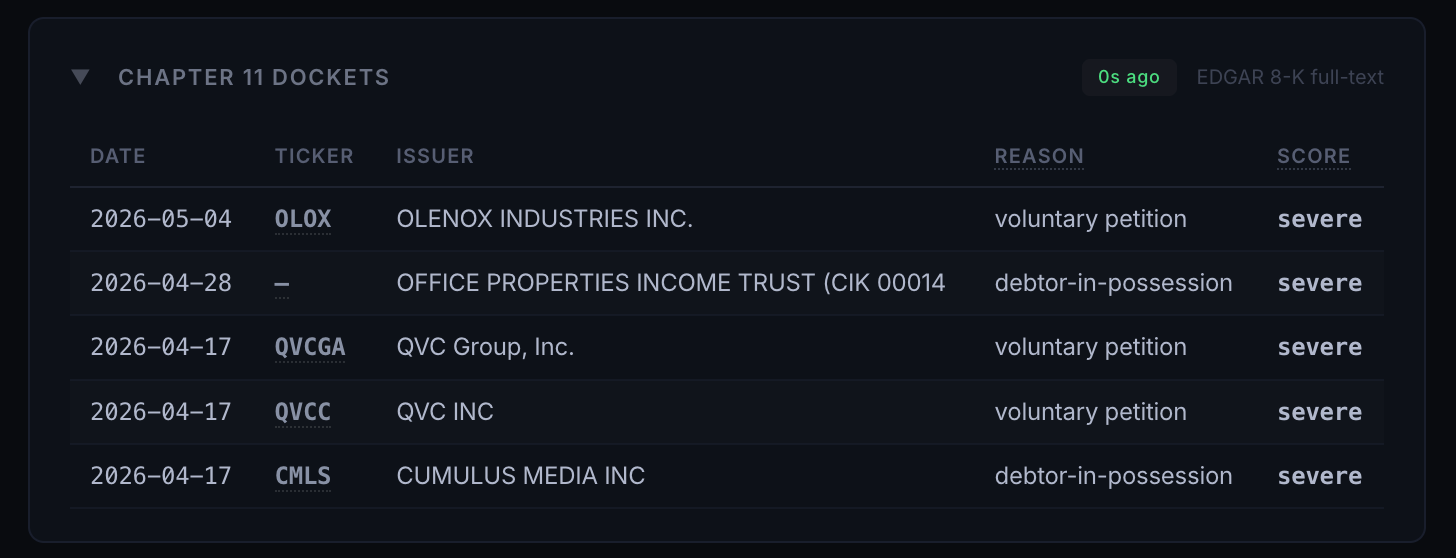
The problem is that trading the absolute direction of an event is essentially gambling. Institutional event-driven desks trade the spread. The system tracks merger arbitrage spreads (merger_arb.py), calculating the annualized yield of a deal closing vs. the downside risk of the deal breaking.
For distressed situations, it aggregates claims agent data (claims_agents.py and bankruptcy.py) to map out the exact capital structure priority.
This engine operates on a strict mandate:
Keep the event-driven bets structurally focused on the spread.
Focus entirely on the mathematical asymmetry of the event outcome.
Leave directional macro guessing to teams running different strategies.
The Live Event-Driven Dashboard
The engine automatically exports the probability matrix into a daily static build and pushes it to a live Vercel deployment.
It tracks upcoming catalysts with live probabilities instead of verbal “I think they’ll beat earnings” takes. It enforces the sum-of-the-parts math, so you always know if a stub equity is mathematically mispriced. It holds a balanced list of merger arbitrage spreads instead of directional bets that blow up the moment the market turns.
(You can view my live Event-Driven dashboard here: https://event-driven-trading.vercel.app
Try It Yourself: A 30-Minute Catalyst Check
You don’t need a custom Python backend to start hunting for structural inefficiencies. You can map out a baseline with a spreadsheet and free SEC data.
Step 1: Pull the raw filings
Take a pending corporate merger. Download the latest DEFM14A (Definitive Proxy Statement) from EDGAR.
Step 2: Build a quick probability matrix
In Excel/Sheets, calculate the current spread: (Offer Price - Current Price) / Current Price. Annualize it based on the expected close date.
Step 3: Approximate the downside
Calculate the “unaffected price” (where the stock traded before the deal leaked). Calculate your downside risk if the deal breaks. If the upside is 4% and the downside is 40%, the market is assigning a roughly ~90% probability of close.
Step 4: Map your catalyst exposure
Pull a list of 5 recent spinoffs. Calculate the current enterprise value of the parent company (the ‘stub’) excluding the value of its stake in the spun-off entity.
You’ll see very quickly how often the market misprices complex corporate structures.
Step 5: Decide if you’re comfortable with the manual work
If the math tells you you’ve been ignoring highly profitable spreads just because the filings are dense, you have three options: ignore it, slowly patch the math by hand, or let a system enforce the discipline for you.
Run this once on a Sunday afternoon, and you’ll have a much clearer view of where real alpha is hiding.
If you want to run this architecture yourself, the full Python source code is available below for premium subscribers.