How I Built an Automated Stock Analyst (And How You Can Too)
Use automation + NotebookLM to build rigorous company analysis in minutes without hallucinations

If you’re interested in how I was able to generate the following three outputs in under 5 minutes, then keep reading. The presentation and notes are especially rigorous in their insights and data.
I’ll also be attaching the NotebookLM file at the bottom of this article so you can chat with it.
Apple Inc. Investment Case (Deck):
Strategic Outlook & Financial Analysis: Apple Inc:
Summary Video (just to illustrate what’s possible):
1) Gathering Data = No More AI Hallucinations
The philosophy here is Gold In, Gold Out.
Most AI investment tips require uploading data manually, but that takes too much time to repeat for 10+ companies and gets messy fast.
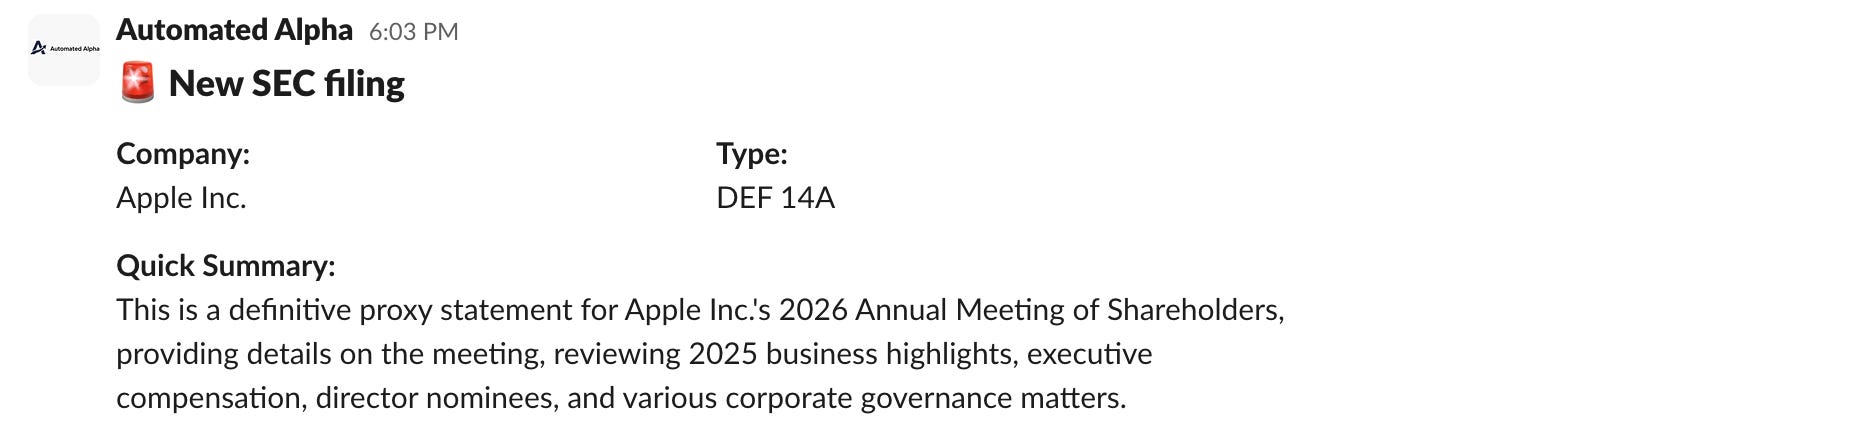
This system uses automation to check for new financial reports (SEC database for 10-Ks, 10-Qs, 8-Ks) however frequently you want. By pulling directly from the source, we ensure the LLM is only fed verified, official financial data.
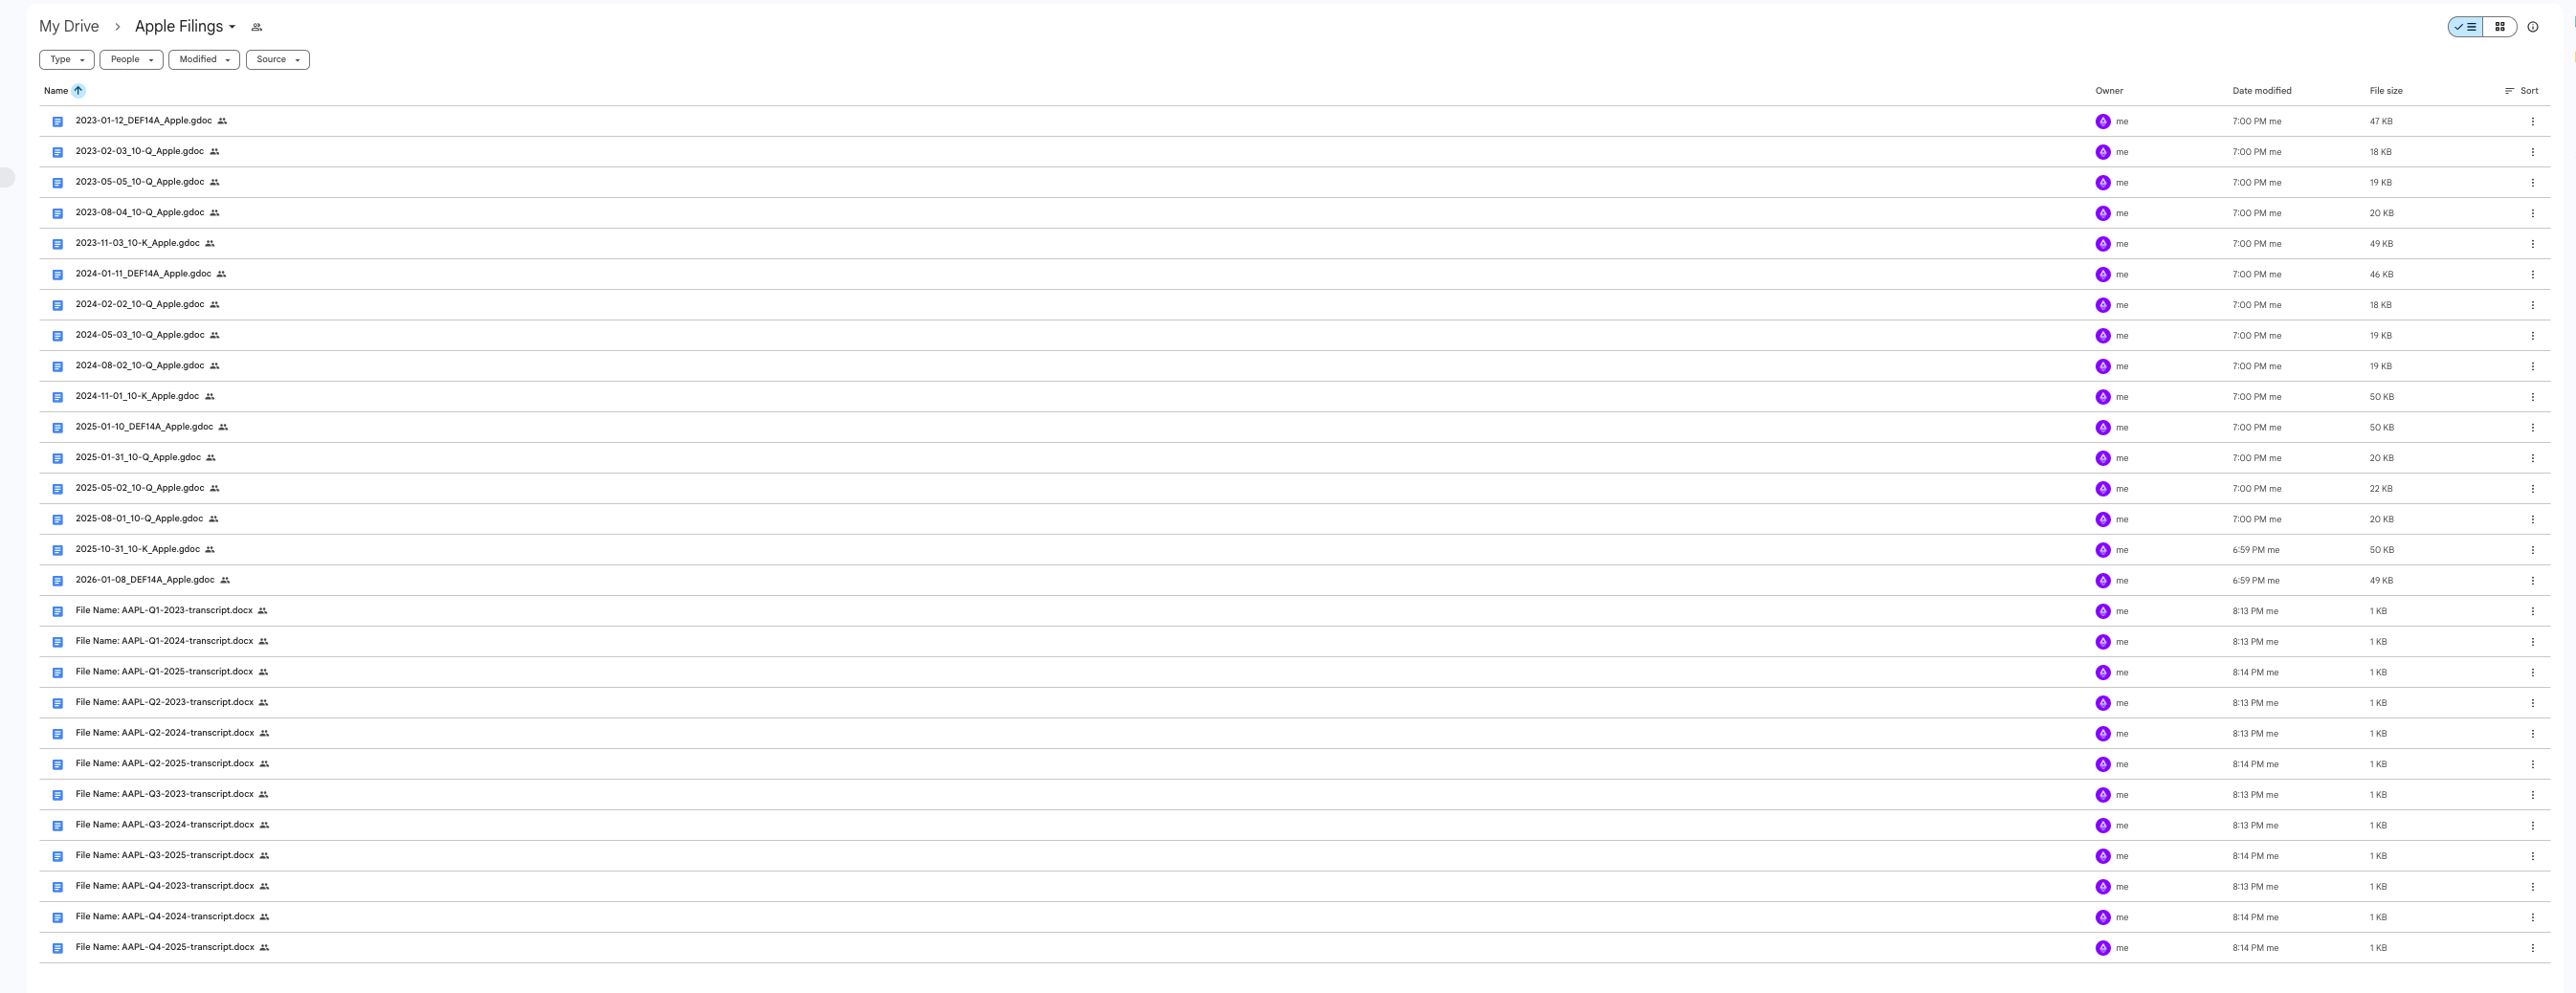
The system retrieved and uploaded the files in seconds to my Google Drive.
How the automation works:
The n8n workflow does three things:
Checks for new filings: A scheduled trigger runs on whatever cadence you set (daily, weekly, after earnings season)
Fetches the reports: It pulls 10-Ks, 10-Qs, and 8-Ks from the SEC database for any company you specify in the Set node
Uploads to Google Drive: The files land in a folder that NotebookLM can read directly
You configure the company name and how many years of filings you want in one place. After that, it runs hands-off.
2) Extracting Insights
Now that we have the data, how can we extract insights accurately? We use Google’s NotebookLM to connect our Google Drive folder to the LLM.
Just go to “Add Sources” and select the Google Drive icon.
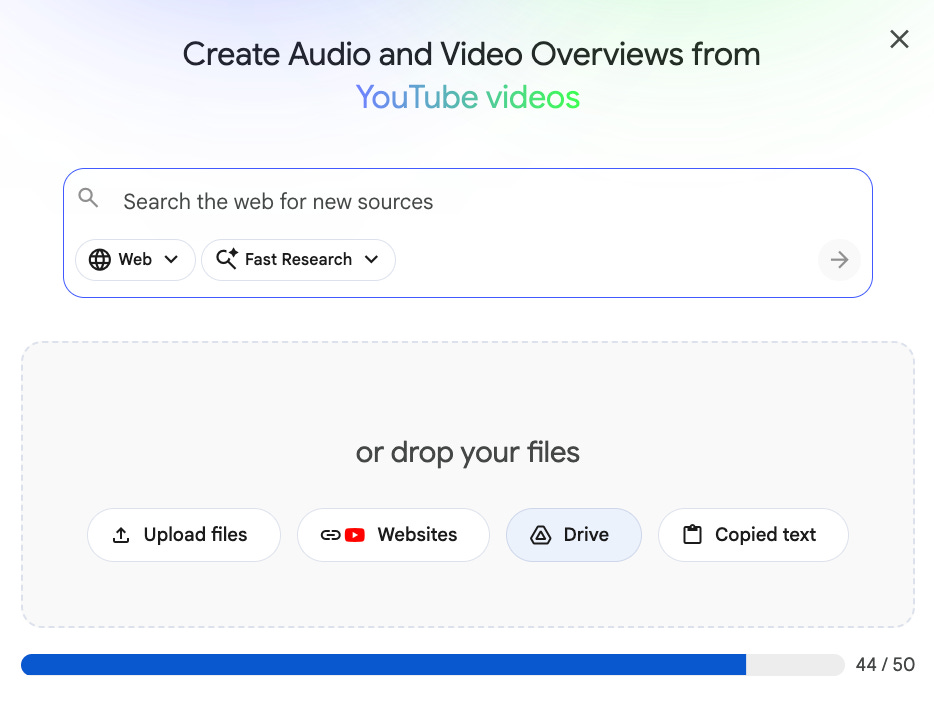
And you’re done.
While you could already start asking the LLM questions, if you want some extra rigor you can add this prompt to the Notebook’s system prompt via the sliders icon in the top right of the chat. Then select “Custom” conversational goal.
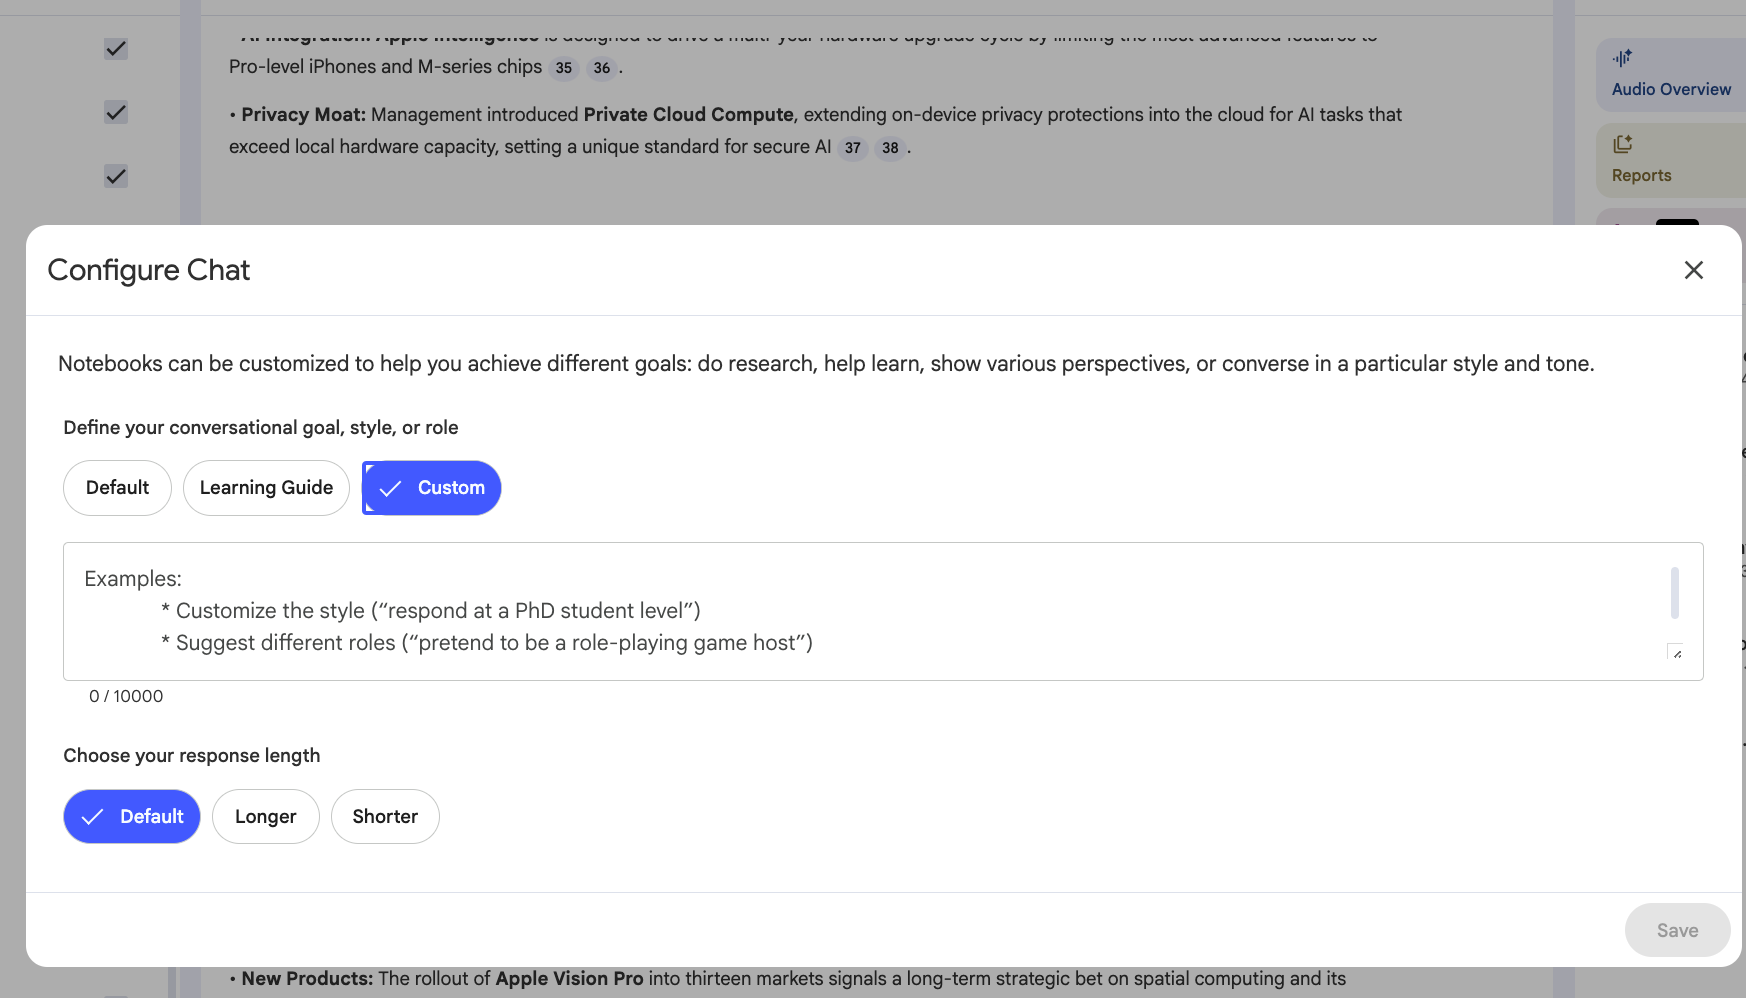
Or you can just start the chat with the prompt (I did this).
While NotebookLM is highly accurate from the get go, I like to give it some standards as to what I’m expecting.
ROLE
Act as my equity research analyst specializing in technology hardware and platforms. You have access to Apple's uploaded financial reports. Use these sources to answer questions with precision, citing specific pages, figures, and disclosures.

OBJECTIVE
Analyze Apple's business from an investor's perspective, covering:
- Revenue composition and segment dynamics
- Margin structure and drivers (gross, operating, net)
- Capital allocation (R&D, capex, buybacks, dividends)
- Cash generation and balance sheet strength
- Key operating metrics and unit economics
- Competitive positioning and moat durability
- Risks, dependencies, and forward indicators

RESPONSE GUIDELINES
When answering questions:
- Use numbers and percentages from the filings
- Cite page numbers or specific tables
- Present answers in bullet points for clarity
- Explain cause and effect (why metrics moved, not just that they moved)
- Highlight what matters for valuation (durability, growth, risk)
- Note any management commentary that reveals strategic intent
- Flag inconsistencies or areas of concern an investor should probe
You can then proceed to ask questions about Apple’s revenue mix, AI and Apple Intelligence integrations, core values regarding privacy and the environment, performance in emerging markets like India and China, etc.
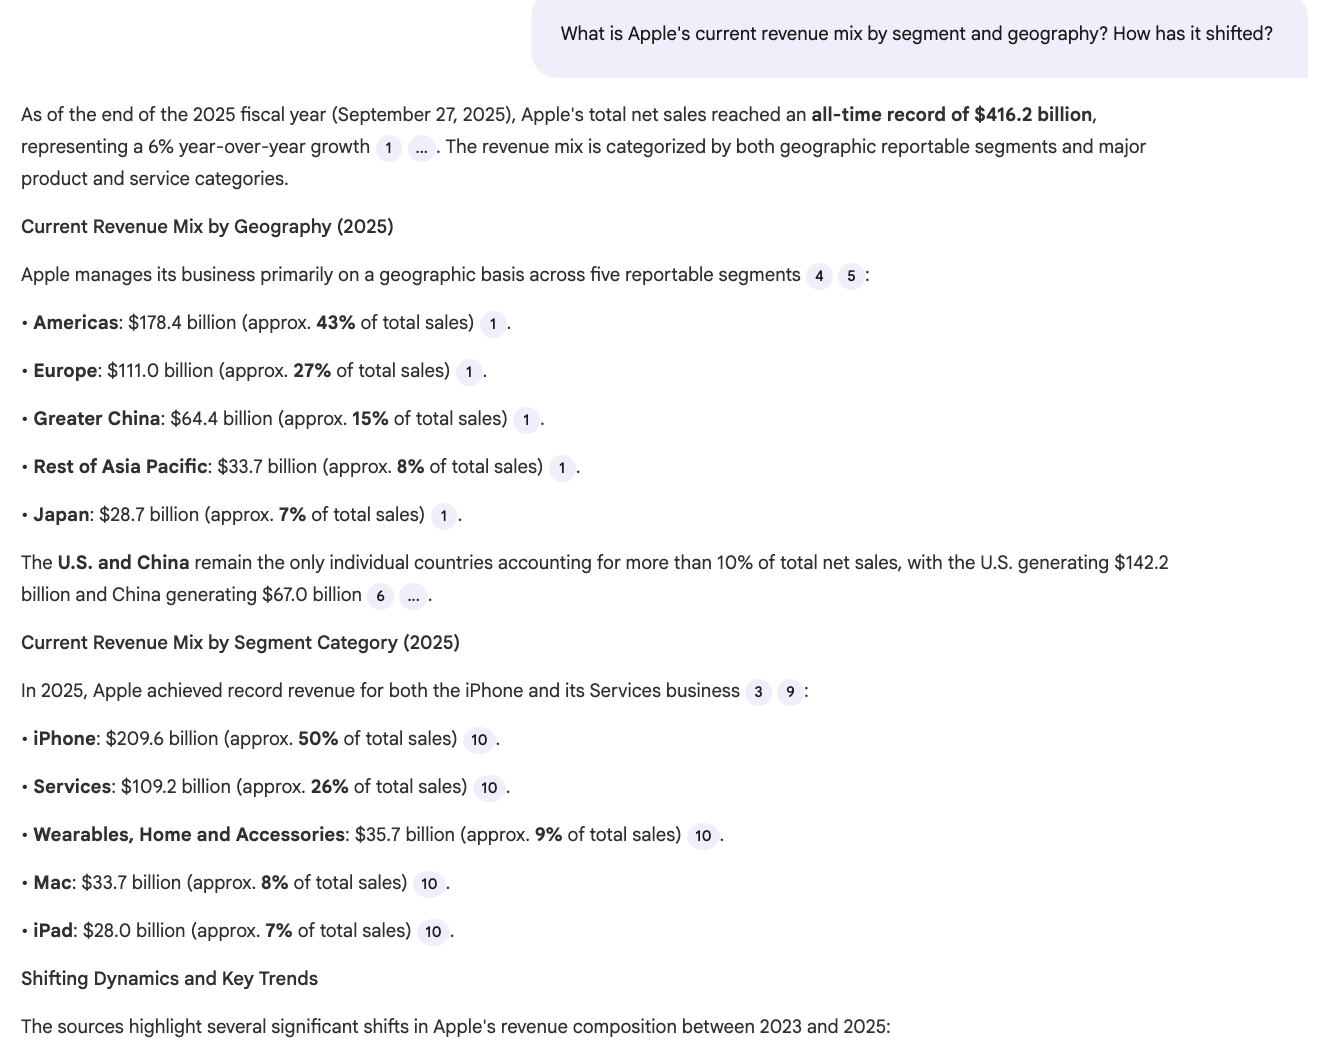
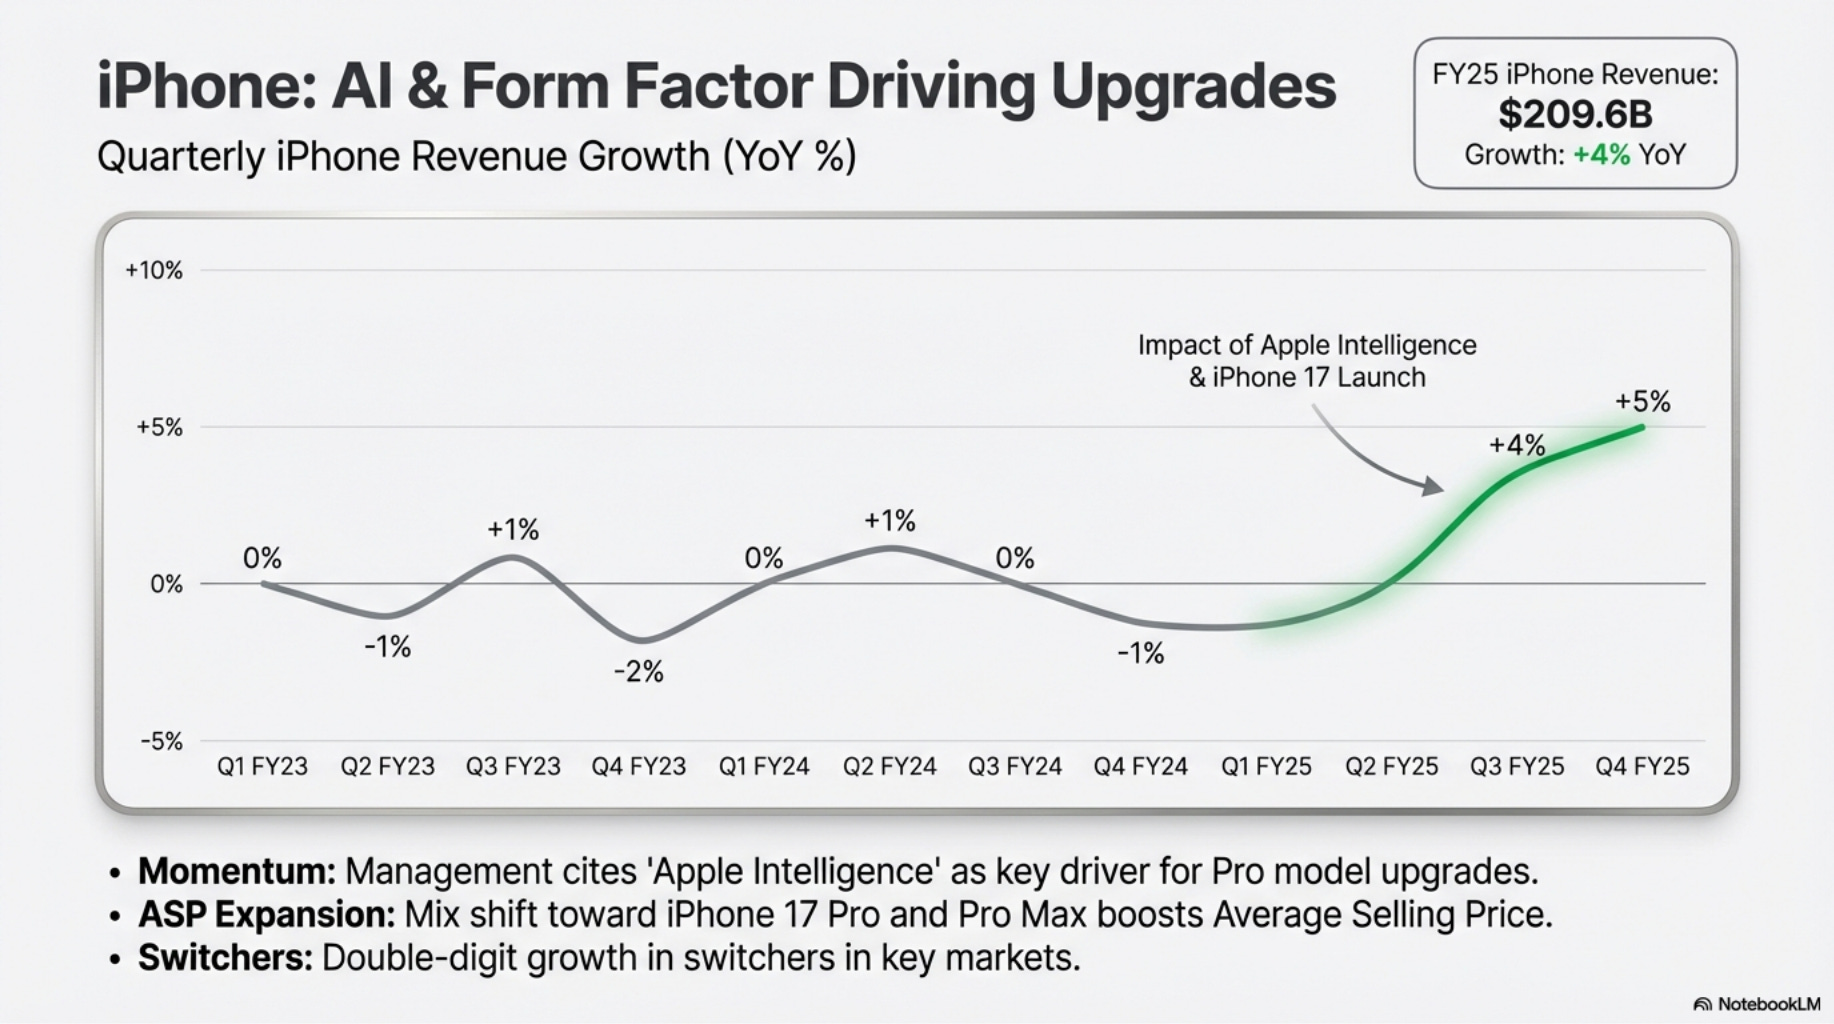
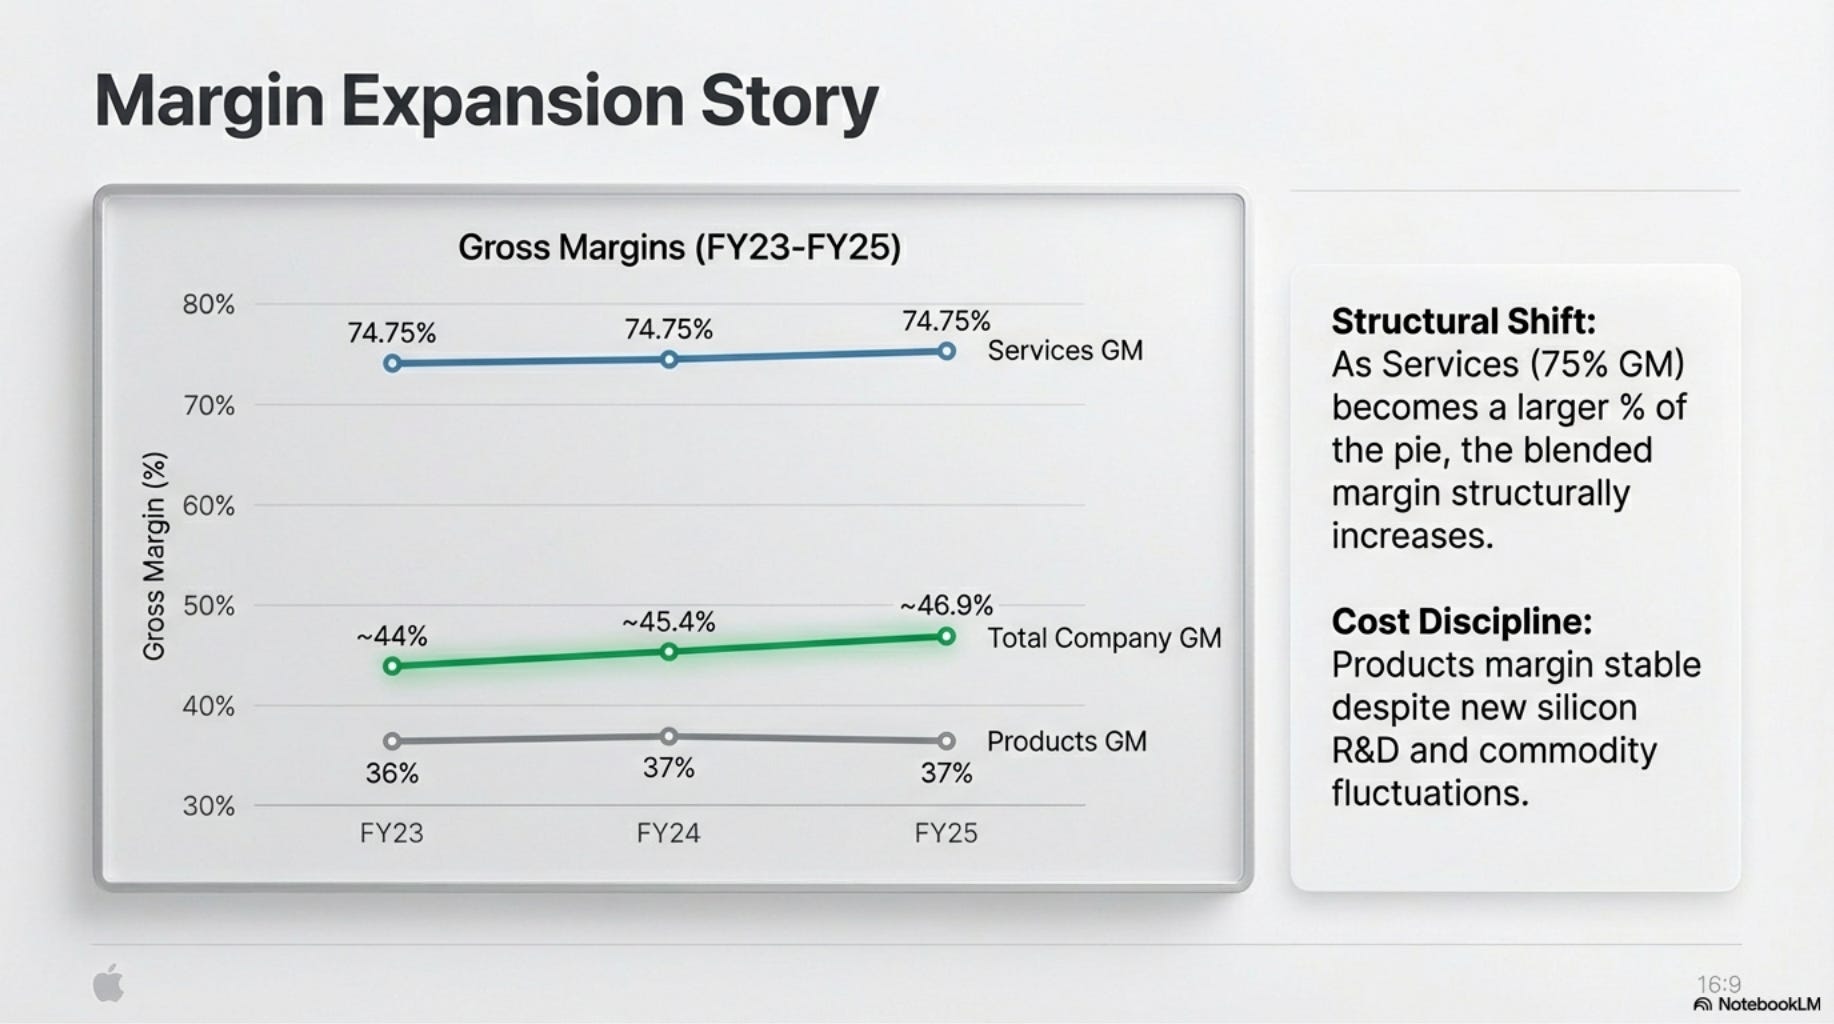
The reason we fetched three years’ worth of financial reports, was so that we could compare the trends over time which is highly valuable and enables the NotebookLM presentation to produce accurate charts like this:
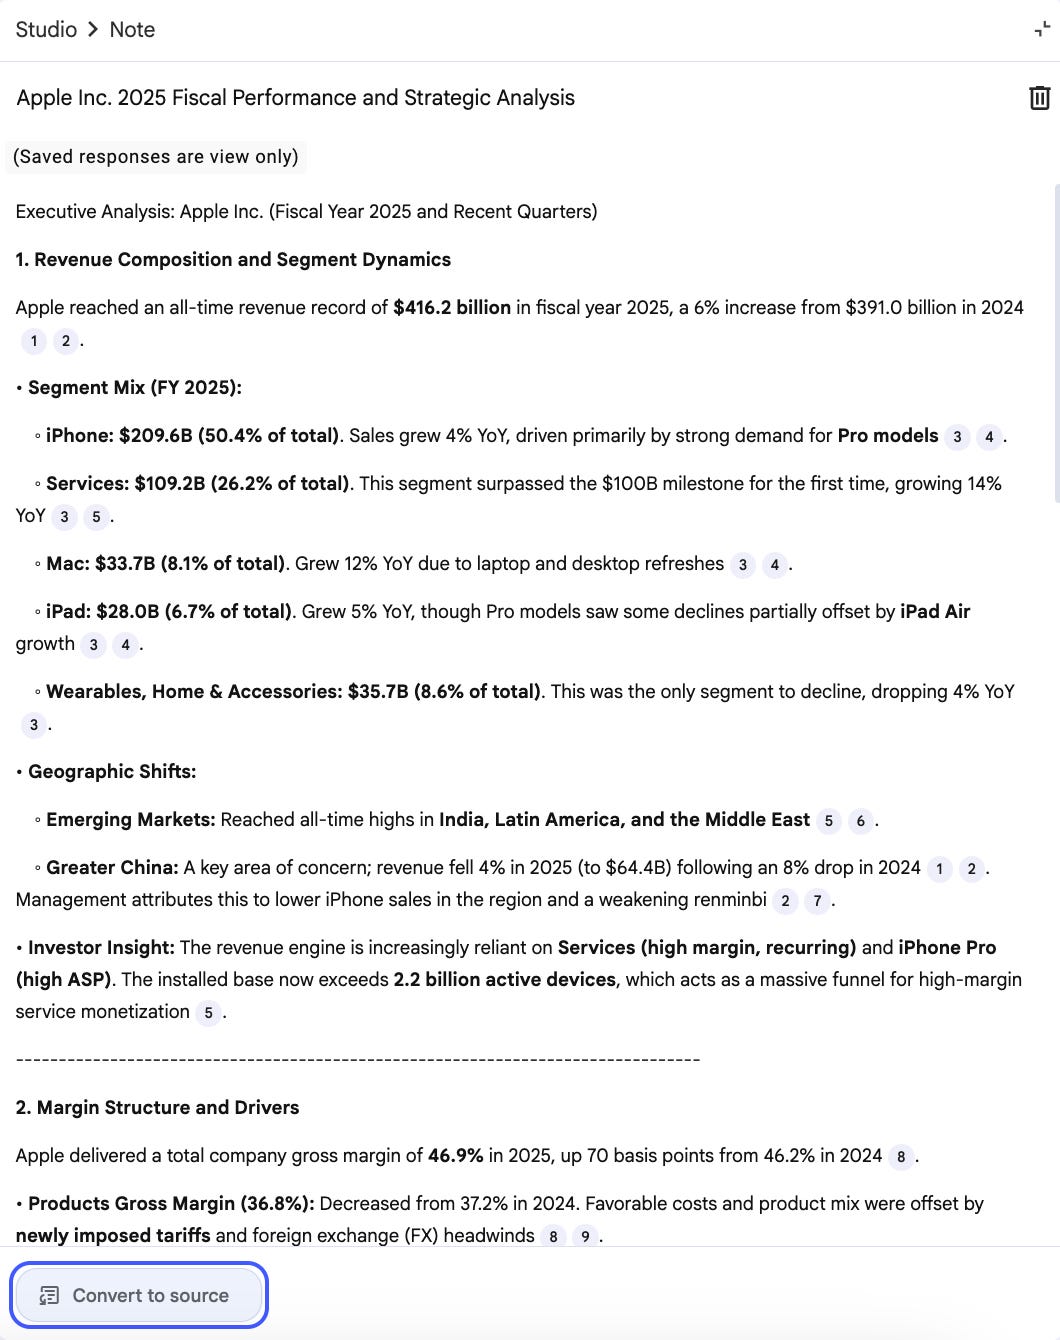
PRO TIP: If you really like an answer or a report the Notebook produces, you can convert that into a Source (button on the bottom left) so the Notebook can use that as a grounded reference going forward.
3) Creating Materials
I particularly like the presentation and infographic outputs. However, you can also extract figures into data tables to analyze in Google Sheets or Excel.
To maximize output quality, use a good prompt for the materials.
The prompt below allows great flexibility if you have a presentation template or a specific presentation flow in mind:
ROLE
You are an Equity Research Analyst preparing an investment presentation on Apple Inc. for a Portfolio Manager or Investment Committee.

OBJECTIVE
Create a 15–20 slide investment deck summarizing Apple’s investment case based on the uploaded financial reports. The presentation should be data-driven, concise, and decision-oriented.

OUTPUT FORMAT (Required for Every Slide)
For each slide, provide:
1. Slide title
2. 3–5 bullet points (maximum 15 words per bullet)
3. Key data points or metrics to display
4. Suggested visual (chart, table, or graphic)

PRESENTATION OUTLINE
- Slide 1: Title & Analyst Info
- Slide 2: Investment Summary (Bull-case thesis)
- Slide 3: Company Overview (Segments & Scale)
- Slide 4: Revenue Breakdown (Geography & Segment)
- Slide 5: Revenue Trends (3-5 year growth)
- Slide 6: Services Deep Dive (Margins & Recurring Revenue)
- Slide 7: Gross Margin Analysis (Product vs. Services)
- Slide 8: Operating Leverage (R&D & SG&A efficiency)
- Slide 9: Profitability (EBIT/Net Income)
- Slide 10: Cash Flow (FCF generation)
- Slide 11: Capital Allocation (Buybacks & Dividends)
- Slide 12: Balance Sheet (Cash & Debt)
- Slide 13: Operating Metrics (Unit economics/ASP)
- Slide 14: Competitive Position (Moat & Ecosystem)
- Slide 15: Risks (Regulatory, Macro, Execution)
- Slide 16: Valuation Context (Multiples & Peers)
- Slide 17: Catalysts (Upside/Downside timing)
- Slide 18: Summary & Recommendation
Free Sample: Apple Investment Notebook (Public Demo)
Before you look at the automation behind this, I want you to see the quality of the output. I have made the Apple Investment Notebook public so you can test the “Gold In, Gold Out” theory yourself.
Try asking it about services margins, capital allocation, China strategy, or specific risks from the 10-K.
🔗 Click Here to Chat with the Apple Investment Notebook (Note: Open in a new tab. Requires a Google account.)
Taking This Workflow Beyond Apple
You’ve seen the quality of the Apple output. Now imagine having this same level of rigor for every company in your portfolio, without the manual data entry.
For those looking to move from “gathering data” to “generating alpha,” paid subscribers receive the full infrastructure to automate their entire coverage list:
Access a growing library of pre-built NotebookLMs for the Magnificent 7 (NVDA, MSFT, GOOGL, AMZN, META, AAPL, TSLA) along with other major tech movers as I build them.
Download the n8n automation files to deploy your own hands-off SEC data pipeline.
Join the private Slack for real-time filing alerts and automated summaries the moment a report hits the desk.